In this tutorial you will learn:
- How to define a boundary for analysis
- Data layers available for analysis
- How to perform analysis
- How to print a summary report of analyses
To start this tutorial, you need:
- Nothing! You can use the demo MapBuilder application at https://my.gfw-mapbuilder.org/v1.latest if you would like to follow the steps in this tutorial.
Defining a boundary for analysis
There are six different ways you can define a boundary for analysis:
- Selected feature: Select any feature from a visible vector data layer.
- Intersection of two selected features: Select two features from the same or different data layers and analyze the intersecting area.
- Drawing: Draw an arbitrary shape on the map.
- Set of coordinates: Enter between 3 and 10 coordinates.
- Shapefile: Upload an ESRI shapefile.
- MyGFW area of interest: If you have a MyGFW account and your MapBuilder application has MyGFW enabled, you can login and select one of your saved areas of interest.
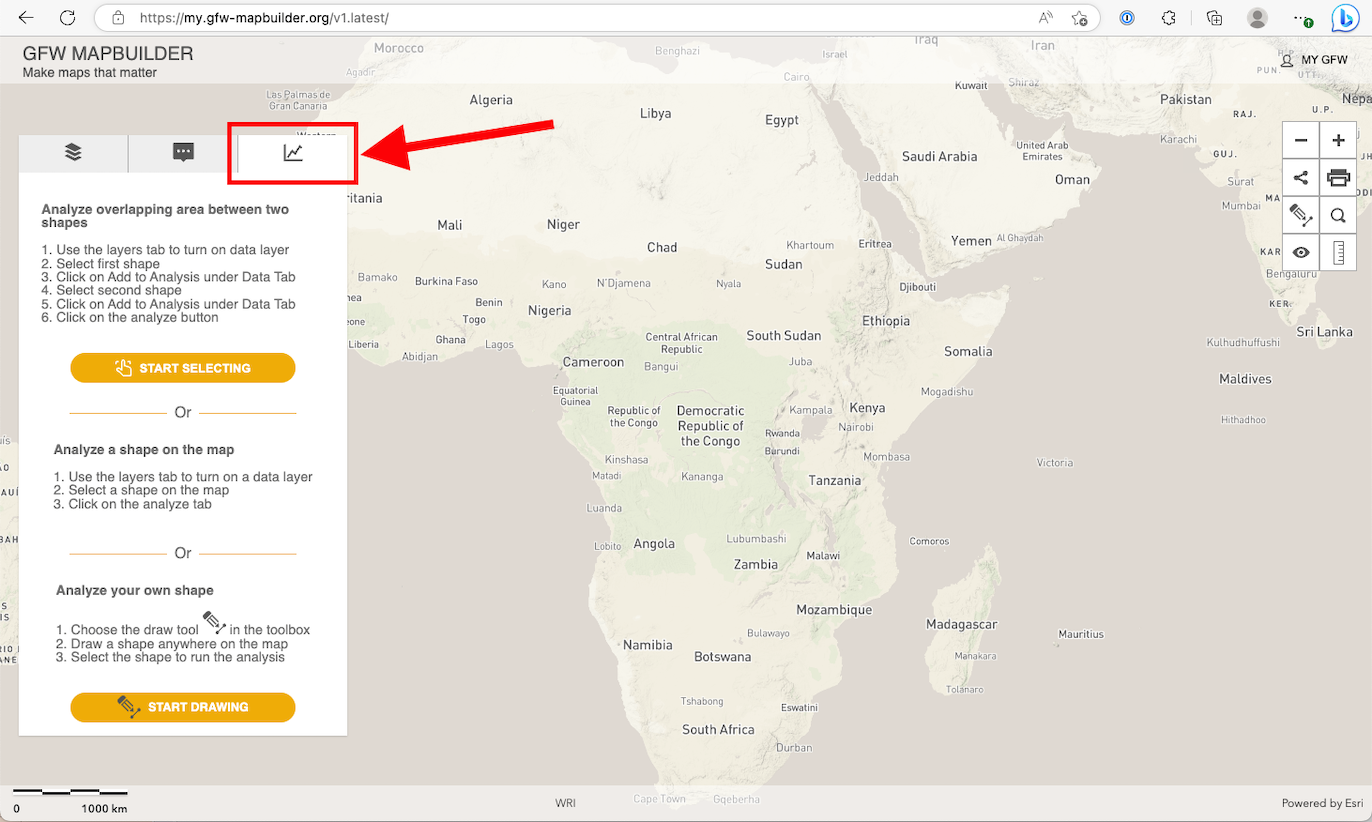
You can access five of these options from the analysis panel. Navigate to the access panel by clicking on the tab with the chart icon, highlighted in the screenshot below.
The only option in a different location is selecting a MyGFW area of interest. If your MapBuilder application has MyGFW login enabled, then you will find this option in the top right of the screen.
Data layers available for analysis
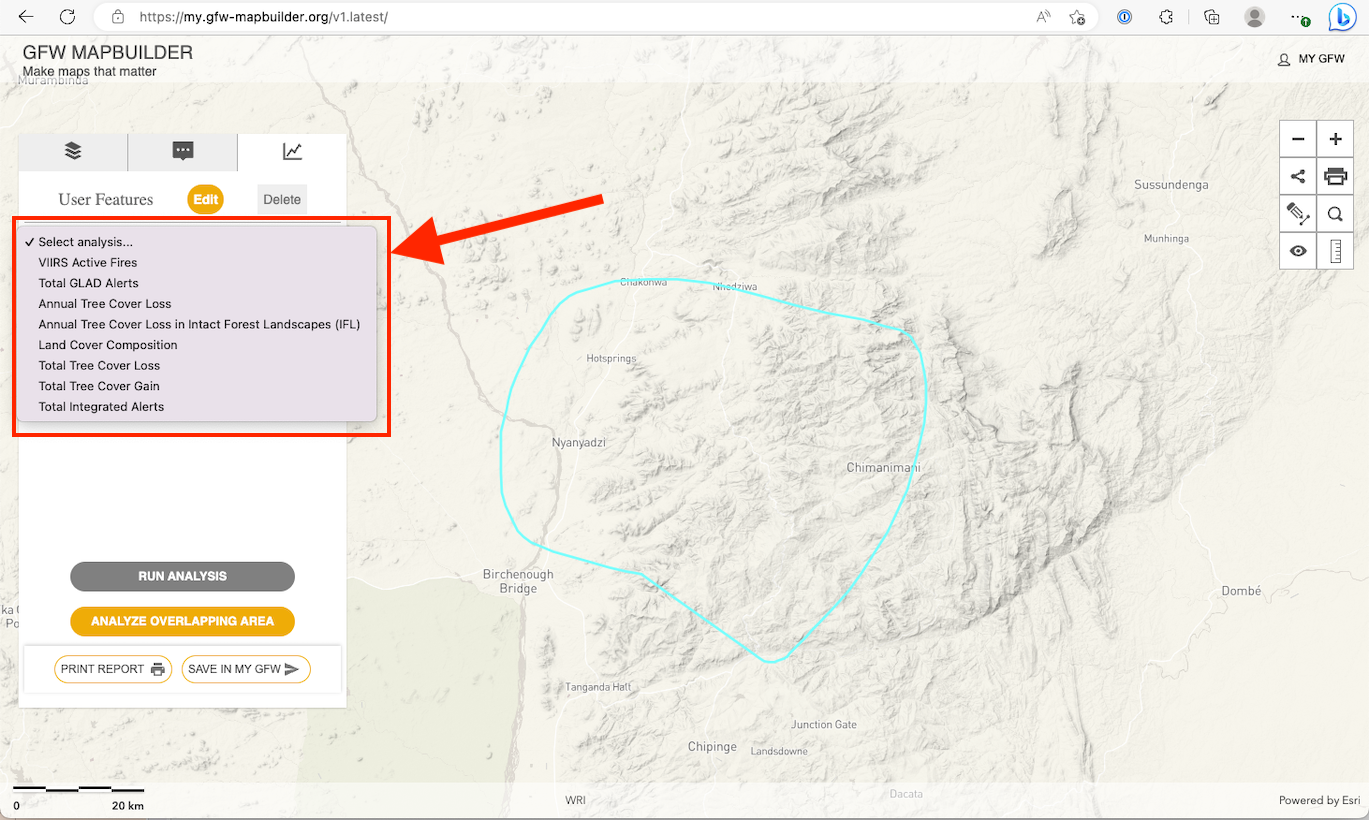
There are seven different datasets that you can base your analysis on:
- VIIRS Active Fires: Counts the number of VIIRS fire alert detections within the selected time range.
- Annual Tree Cover Loss: Shows the annual tree cover loss since 2001.
- Annual Tree Cover Loss in Intact Forest Landscapes (IFL): Shows the annual tree cover loss since 2001. Results will not be available if the area you selected does not include IFL.
- Land Cover Composition: Shows the area of each present land cover type.
- Total tree cover loss: Computes the total area of tree cover lost for regions with greater than 30% tree canopy density.
- Total tree cover gain: Computes the total area of tree cover gain from 2000 to 2012.
- Total Integrated Alerts: Counts the number of integrated alerts (GLAD-L/GLAD-S2/RADD) within the selected time range.
You can select which dataset to perform analysis on from the analysis panel after you have selected a boundary. The list of datasets is highlighted in the screenshot below. Read more information about the datasets on MapBuilder here.
Perform analysis
1. Define a boundary
We will demonstrate three of the different ways to define a boundary.
1a. Select a feature
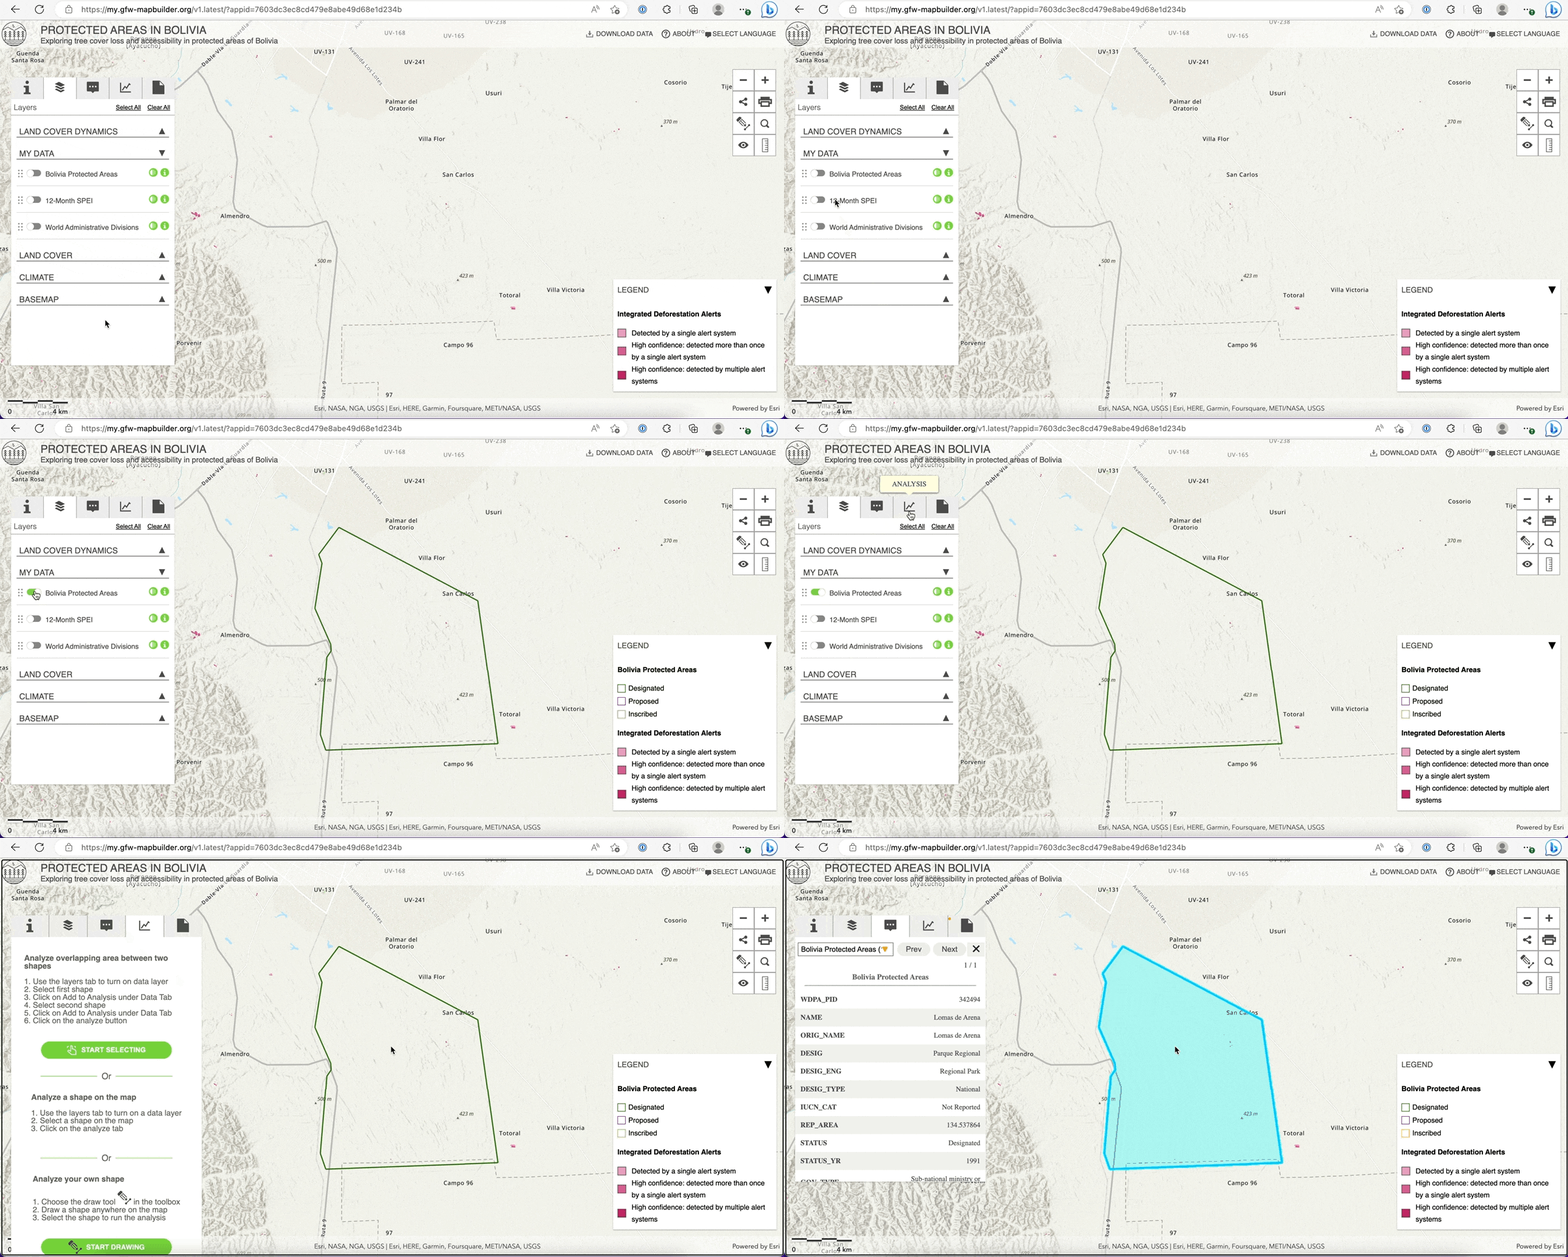
- Turn on a vector data layer.
- Locate the feature you are interested in analyzing in the map.
- Click on the feature.
1b. Drawing
- Click on the analysis tab.
- In the analysis panel, scroll down to the section titled "Analyze your own shape".
- Click the button labeled "Start drawing".
- On the map, click and hold while drawing a shape. Let go when you are finished.
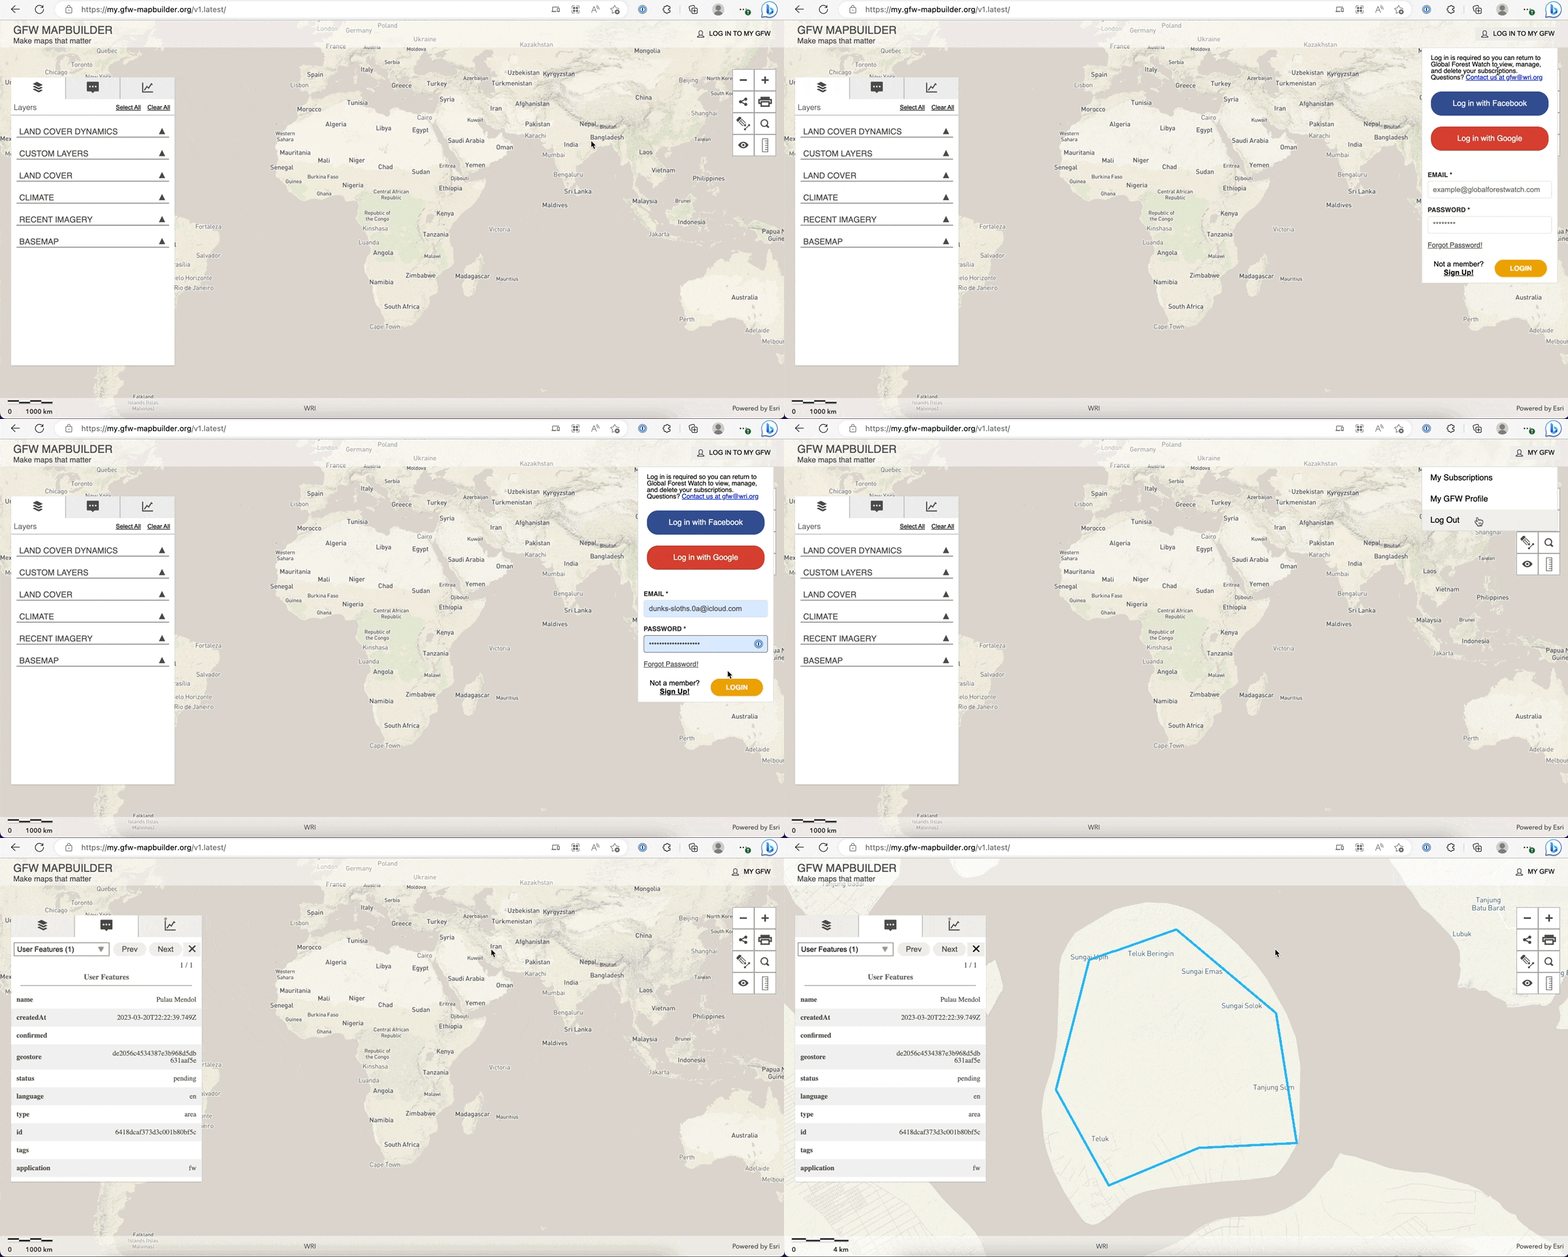
1c. MyGFW
- Click the button labeled "MyGFW" in the top right of the screen.
- Login to your MyGFW account.
- Click on "My Subscriptions".
- Locate your area in the list then click on the button labeled "View on Map".
Print a summary report
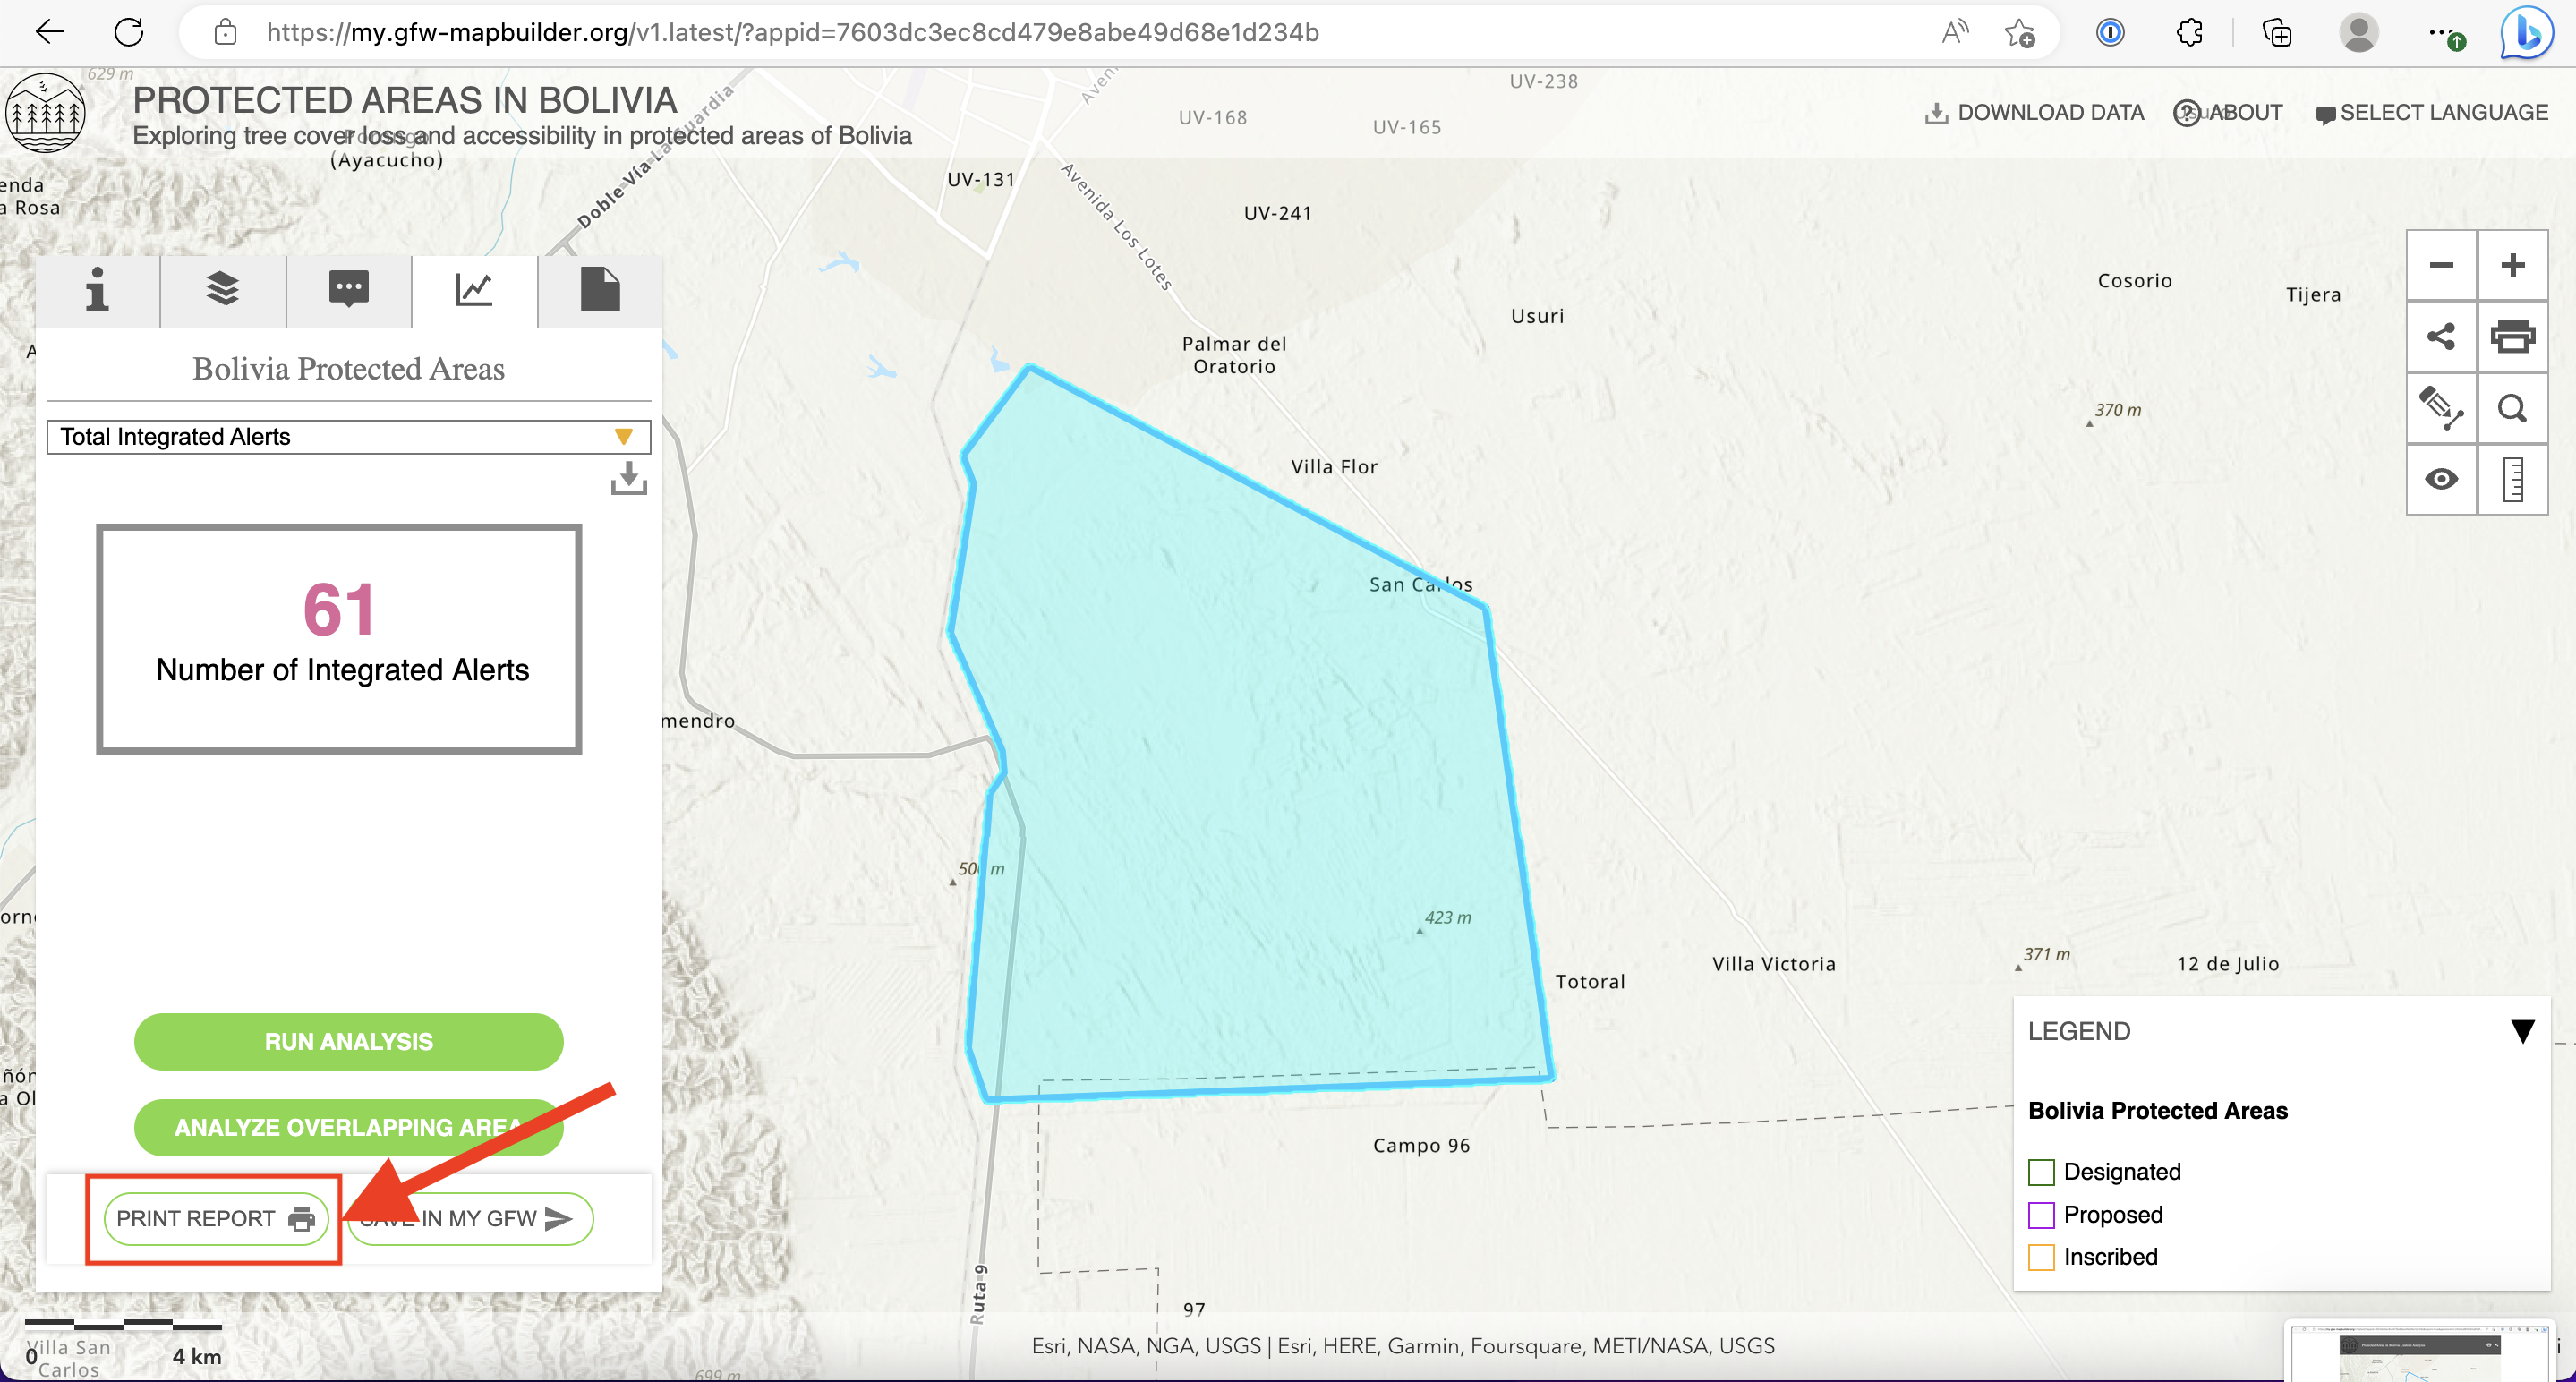
- After you perform analysis, click the button labeled "Print Report". You will be brought to a new page with a summary of analyses.
- Click the button with the printer icon to print this report or to save it as a PDF.
If you need additional assistance, please do not hesitate to contact us.

